The slides of our presentation at the GESIS Computational Social Science Wintersymposium on December 3 in Cologne, Germany, are now available.
If you have any questions about our talk, send us an e-mail!
Uncovering Networks of Corporate Control
The slides of our presentation at the GESIS Computational Social Science Wintersymposium on December 3 in Cologne, Germany, are now available.
If you have any questions about our talk, send us an e-mail!
Who is steering fossil fuel extraction in Western Canada and what influence do they wield? These central questions are driving a six-year research and public engagement initiative, Mapping the Power of the Carbon-Extractive Corporate Resource Sector, with funding from the Social Sciences and Humanities Research Council (SSHRC). The project brings together researchers, civil society organizations and Indigenous participants to study the oil, gas and coal industries in British Columbia, Alberta and Saskatchewan. CORPNET is an international partner and co-investigator in the project.
Hosted by the University of Victoria, the partnership is jointly led by the university, the Canadian Centre for Policy Alternatives (BC and Saskatchewan offices) and the Parkland Institute at the University of Alberta. In addition to the $2.5-million SSHRC award, the project is also supported by $2 million in matching contributions. (Please see backgrounder for further details on funding contributions and participants.)
“We’ve seen a rapid acceleration of fossil fuel extraction in recent years,” says Dr. Bill Carroll, UVic professor of sociology and co-director of the partnership. “Yet our knowledge of the companies involved and how they influence decision-making about our publicly owned carbon resources is remarkably sparse.”
“Our research will help Canadians gain a clearer picture of who’s-who in this increasingly important sector of Canada’s economy,” says Shannon Daub, who co-directs the partnership on behalf of CCPA-BC.
The partnership’s work will focus in four key areas:
• A systematic mapping of how the carbon-extractive industry is organized—which companies are involved, who runs them, who owns them and how they connect to broader international corporate networks.
• Analysis of the sector’s influence on public debates and policy making—such as efforts to secure social license, and corporate links to governments, political parties, lobby groups and private foundations.
• Case studies of contentious “flashpoints”—such as the expansion or development of new mines, pipelines, oil fields or export facilities.
• Development of an open source, publicly accessible corporate database—along with a training program for citizens and civil society groups, many of whom will contribute and update data.
https://www.policyalternatives.ca/node/13239
http://communications.uvic.ca/releases/release.php?display=back&id=227
This post is the first in a series of blog posts aimed at a broad academic audience, giving an example of the work done in the CORPNET group. These posts are not meant as full self-contained scientific articles, but merely serve to illustrate the type of research done in our group.
The following post is about the board interlock network of Italy, and what network modelling can tell us about the connectedness of the Italian economy, specifically paying attention to the difference between the north, center and south of the country. Techniques from the field of network analysis are used, including component analysis and centrality measures. This blog post was written by master student Roberto Lucchese as part of an explorative analysis of the corporate network of Italy.
Centrality Measures applied to Italy’s Corporate Network
Roberto Lucchese
Here we study the corporate network of Italy in an attempt to acquire more knowledge and understanding of its topological, structural and complex properties.
Why a network approach?
Network science is an increasingly important field into the study of so-called complex systems. Everything, potentially, could be translated into a network model. Railway routes and stations, financial transfers and electric power distribution are just a few examples. Using a network approach we are able to transpose very complex systems and problems into understandable and easy to analyze models of objects (nodes) and relationships between these objects (called edges). In this work, we model companies or firms as nodes, whereas edges represent a shared board member between these companies.
The Italian corporate board network
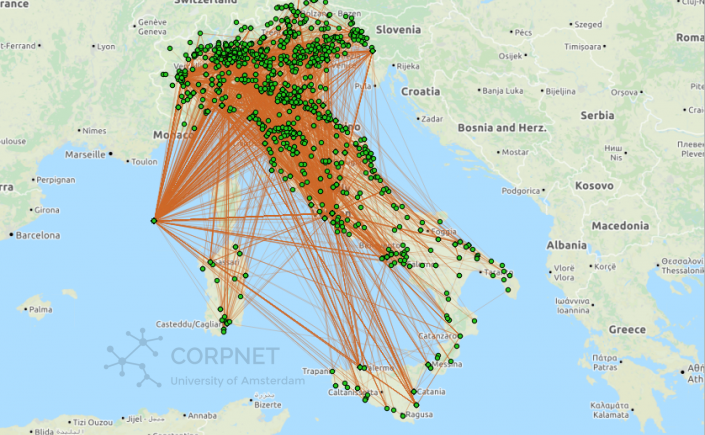
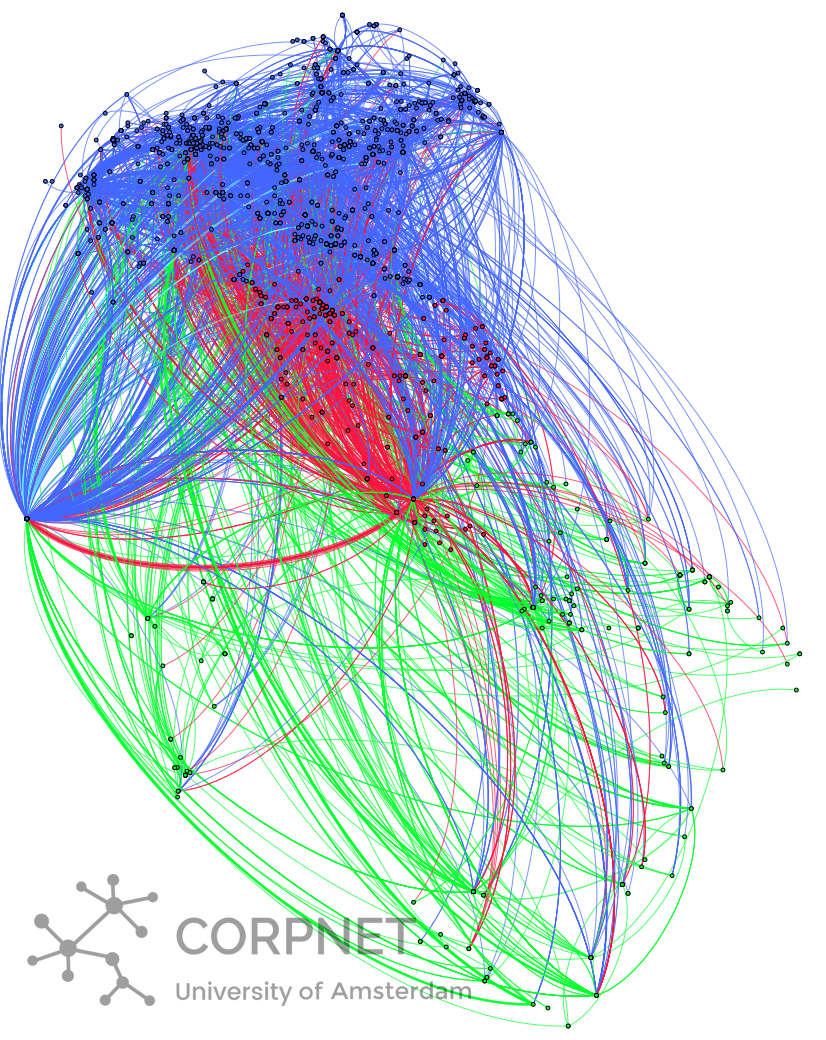
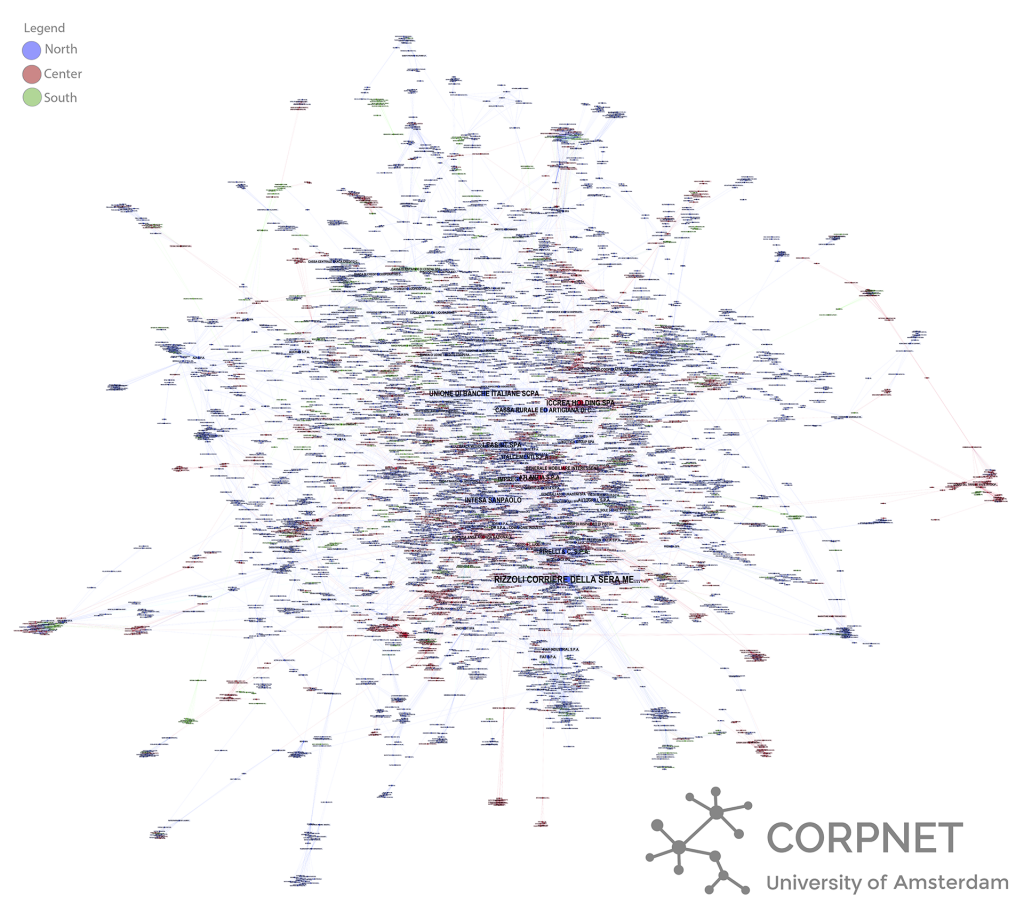
The image on top of this post and Figure 1 above show our corporate board network, specifically its giant component, being the connected component containing the largest fraction of nodes. Or, in other words, the largest subset of companies that are (indirectly) connected with each other. In Figure 1 the actual skeleton of the network is shown. Each node represents a company and (weighted) edges between them represent the directors they share. Two companies sharing four directors, for example, will be described by two nodes linked by an edge with weight four. We also assign a color to every node representing its geolocation inside the Italian territory, namely: in blue we represent companies located in northern regions, in red we represent companies located in central regions and in green companies in southern regions (including Sardinia and Sicily). In the image on top of this post, the skeleton of the network was projected into an interactive OpenStreetMap. Companies for which the city was unknown have been purposely located in the Tyrrhenian Sea, close to the west coast of Corsica.
In order to create this network, we extracted from a 2013 snapshot of the Orbis database all 37,569 Italian companies, registered as “large” or “very large” and as “active”. Also, only companies for which information was available about the senior directors (board of directors, executive board, supervisory board or senior management) were selected.
Dataset and giant component
Figure 2 presents the size of the dataset we study. We notice how the percentage of edges in the giant component is high with respect to the percentage of nodes. Indeed, almost the 50% of the interlocks belong to the giant component of the network while only the 12% of companies are included. From this, one can see how companies inside the giant component, that represent the largest connected sub-economy, are really strongly connected and the phenomenon of the so-called lobby of directors is clearly noticeable. For the definition of lobbies we refer to the work of Caldarelli and Vespignani’s [1] where a “subset of directors of a boards who co-serve on an outside board together with a director of the present board” is called a lobby.
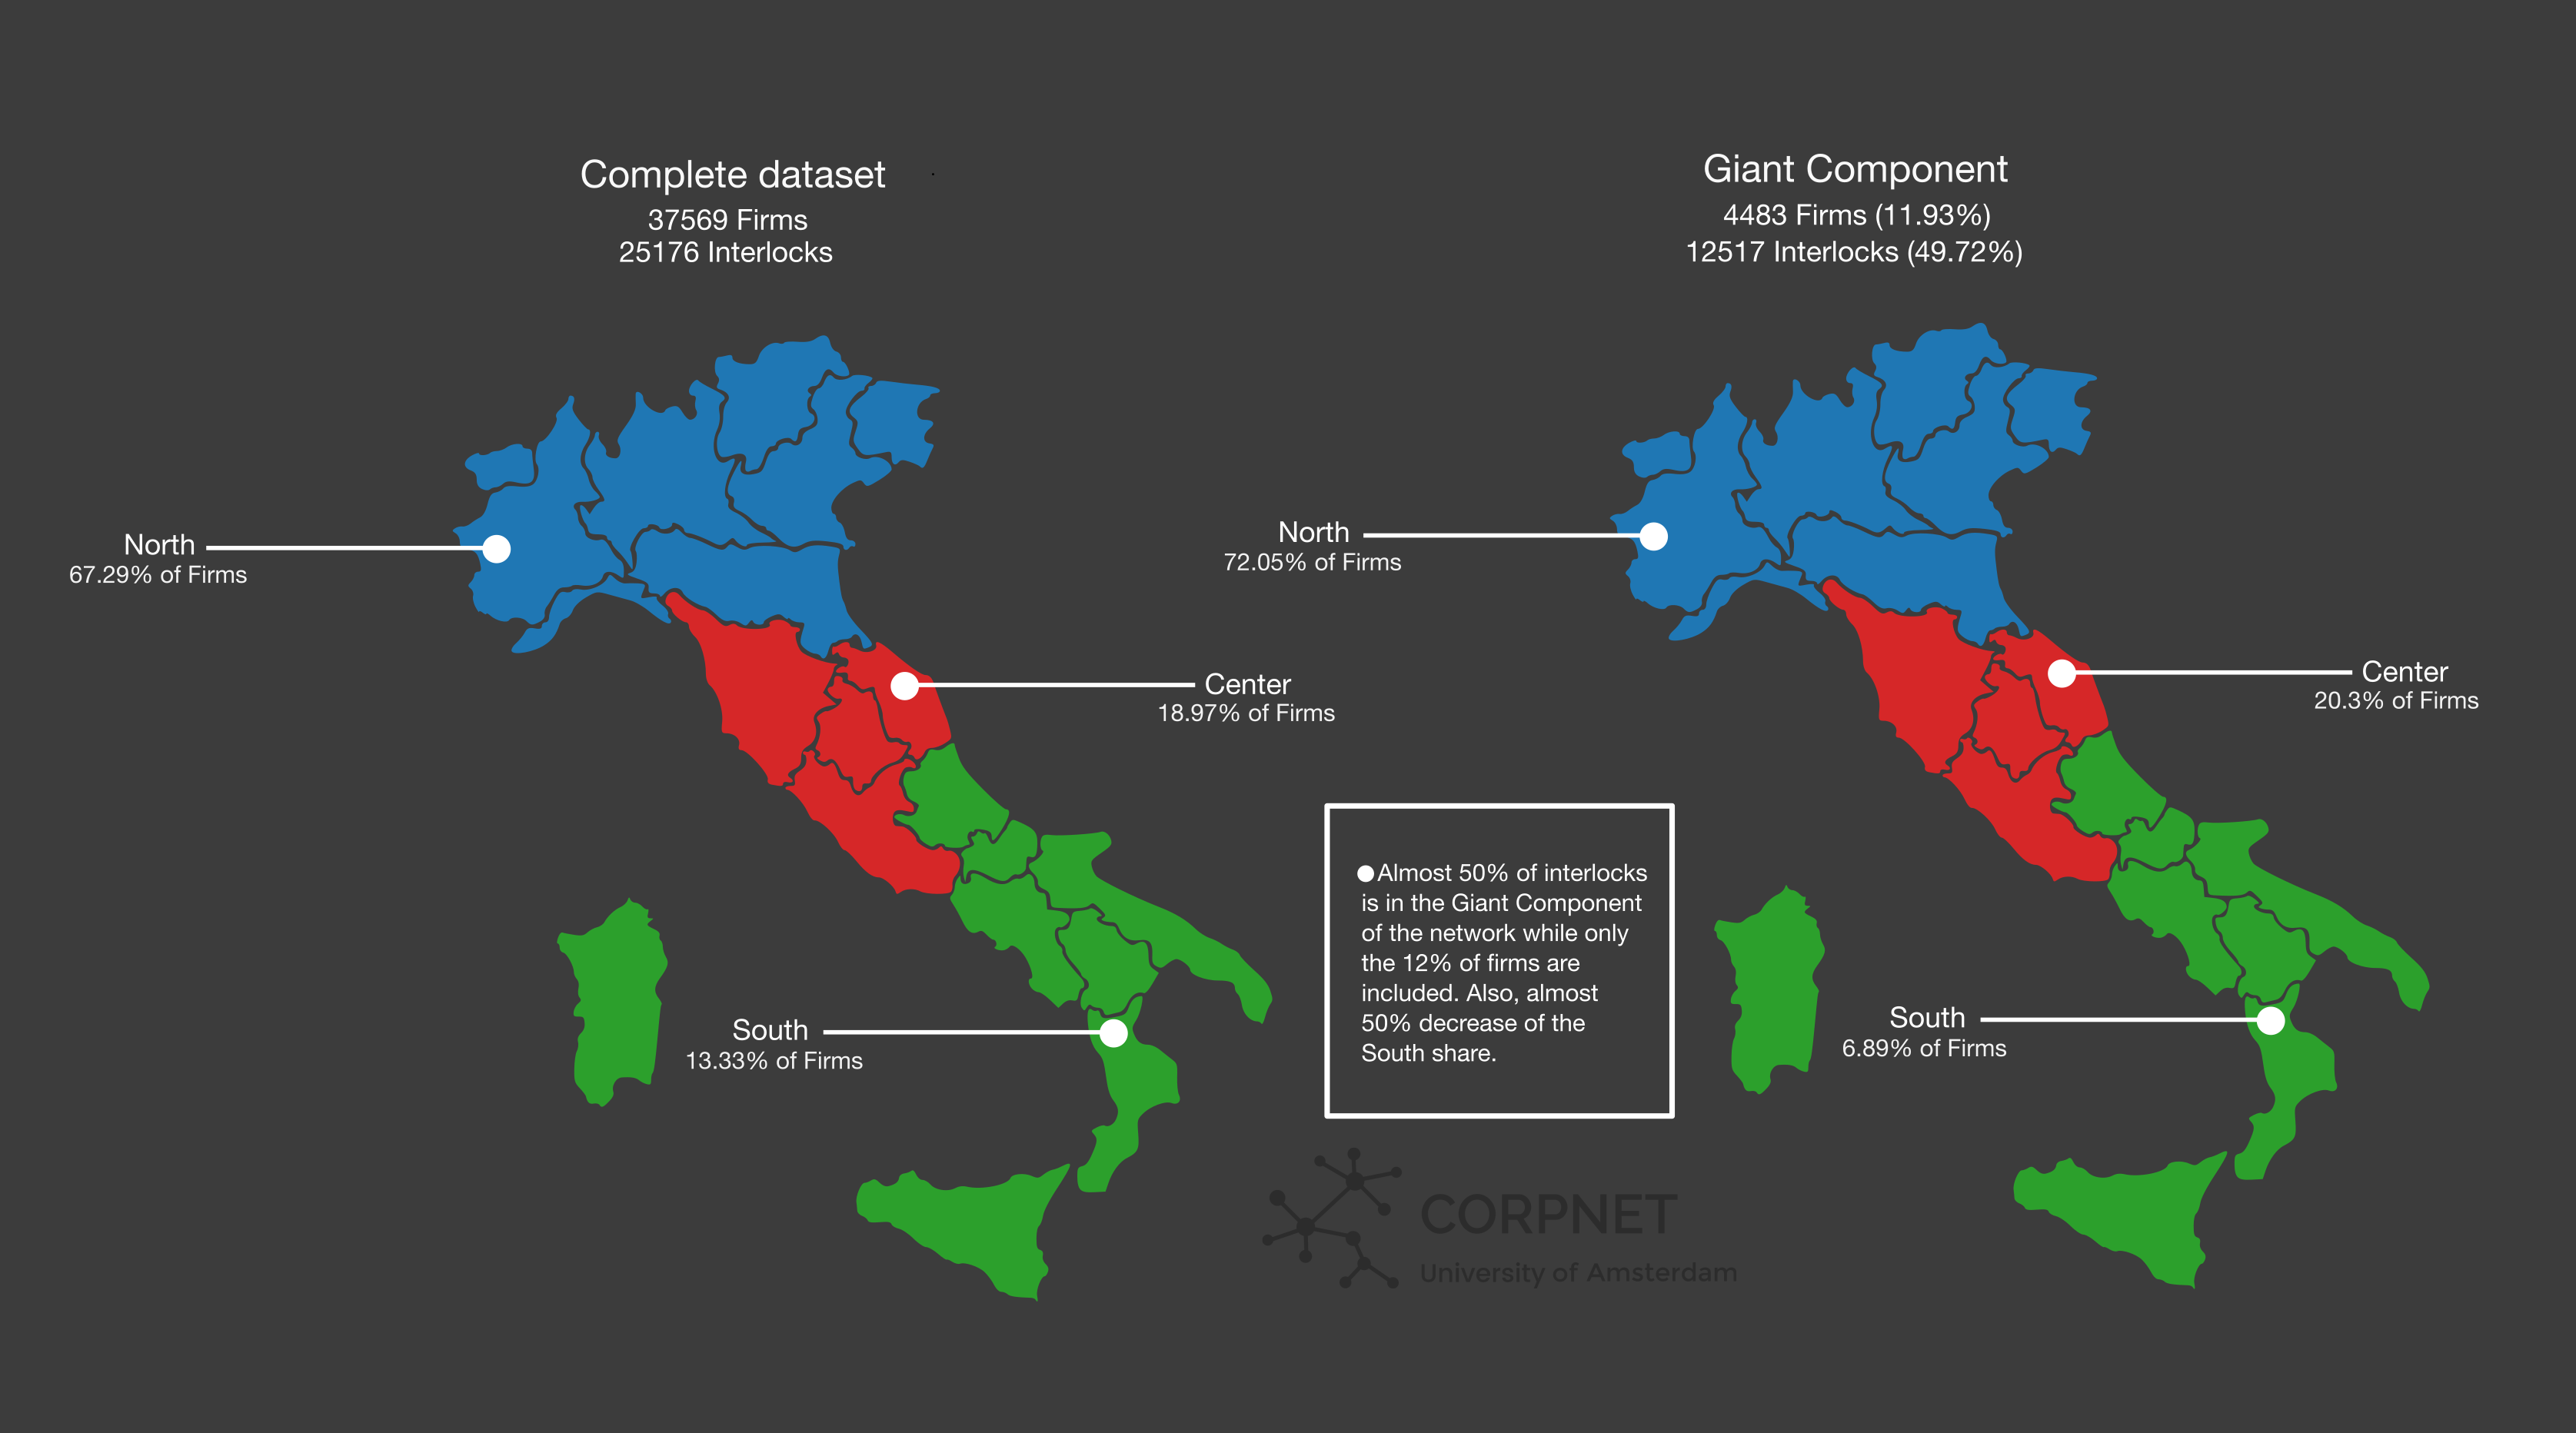
It is also worth to notice from Figure 2 how going from the complete dataset to the giant component network, the share of the companies belonging to the South of the country decreases by almost 50%.
In Figure 3 the network containing only connected components is also presented. In this network, companies that do not share any directors have been filtered out. Here, one should notice how going from the complete dataset, containing about 37,000 companies, to the “connected components“ network, containing about 16,000 companies, the number of nodes decreases drastically as all unconnected firms are filtered out. A reduction of almost 57% of the companies.

From this result we can easily see how unconnected businesses still represent a significant part of the country’s economy. One hypothesis is that many of these are “family-run” businesses, where directors sits only in one board.
Is the Giant Component also the main sub-economy?
In order to answer this question we run the following experiment: we take from the complete dataset, with about 37,000 companies, only the top 4483 (exactly the giant component size) by ranking (the higher is the total revenue, the higher the ranking value) and we then again look at the percentage of companies that lay in the giant component. In other words, we want to generate a new network with the same amount of companies of the giant component network from the complete dataset and we want to see how many of those companies belong to the giant component.
From the results, that show how only the 33% of those “top-companies” are in the same giant component, we could state that the giant component is the largest connected sub-economy of the country for the number of companies, but it is not the main sub-economy based on revenue. Weakly connected and/or “family-run” businesses in the Italian territory are thus likely a significant part of the total economy.
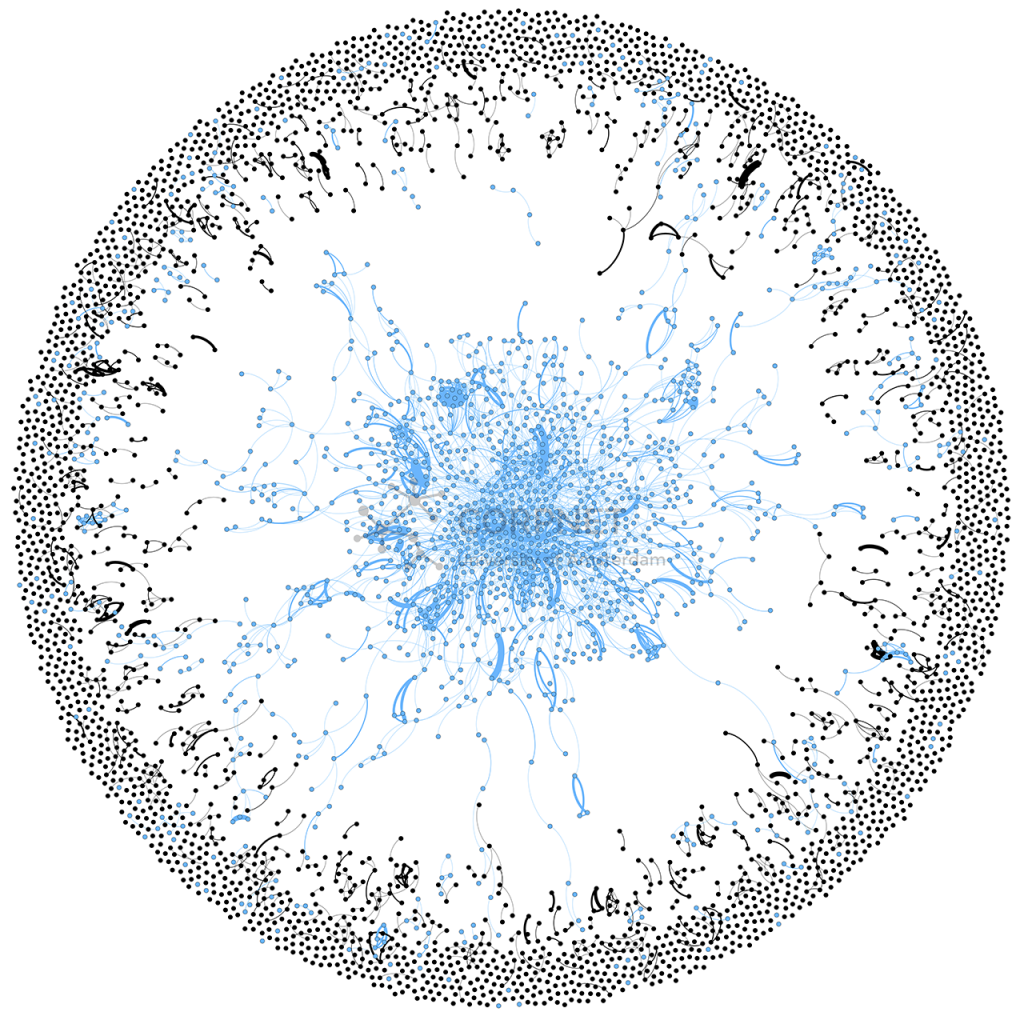
Figure 4 shows the network of the aforementioned top 4483 firms. One can immediately see how the giant component’s companies are surrounded by the the weakly or unconnected companies.
Component Analysis
But what happens outside the giant component? Are there other large components? In order to answer these questions we decided to study the second largest connected component, for which statistics are presented in the following table:
[table]
Description , Giant component, 2nd largest component
Nodes, 4483, 34
Edges, 12517, 53
[/table]
Looking at the numbers presented in this table, we can confirm that outside the giant component there is an high number of possibly family-run companies (or more in general, unconnected companies) and/or small clusters of companies. For this reason we decide to mainly focus on the giant component of our network. Despite this, some references and comparisons with the overall network and the connected components network will be made.
Betweenness Centrality
Centrality measures allow us to identify the most important nodes based on the structure of the network. Here, in particular, we use betweenness centrality, which assigns a value at each node proportional to the number of times that particular node is present in the shortest path between two other nodes. In this way we can easily see nodes that act as bridges within the network.
In Figure 5 we see the Italian board corporate network’s giant component, where the node size is proportional to its betweenness centrality. In particular, bigger size nodes are the ones for which the centrality value is higher. Also, colors are assigned to nodes based on the geolocation in which companies are based (North, Center or South).
From the network above we isolated the Top-100 companies by revenue. The result is shown in Figure 6 below.
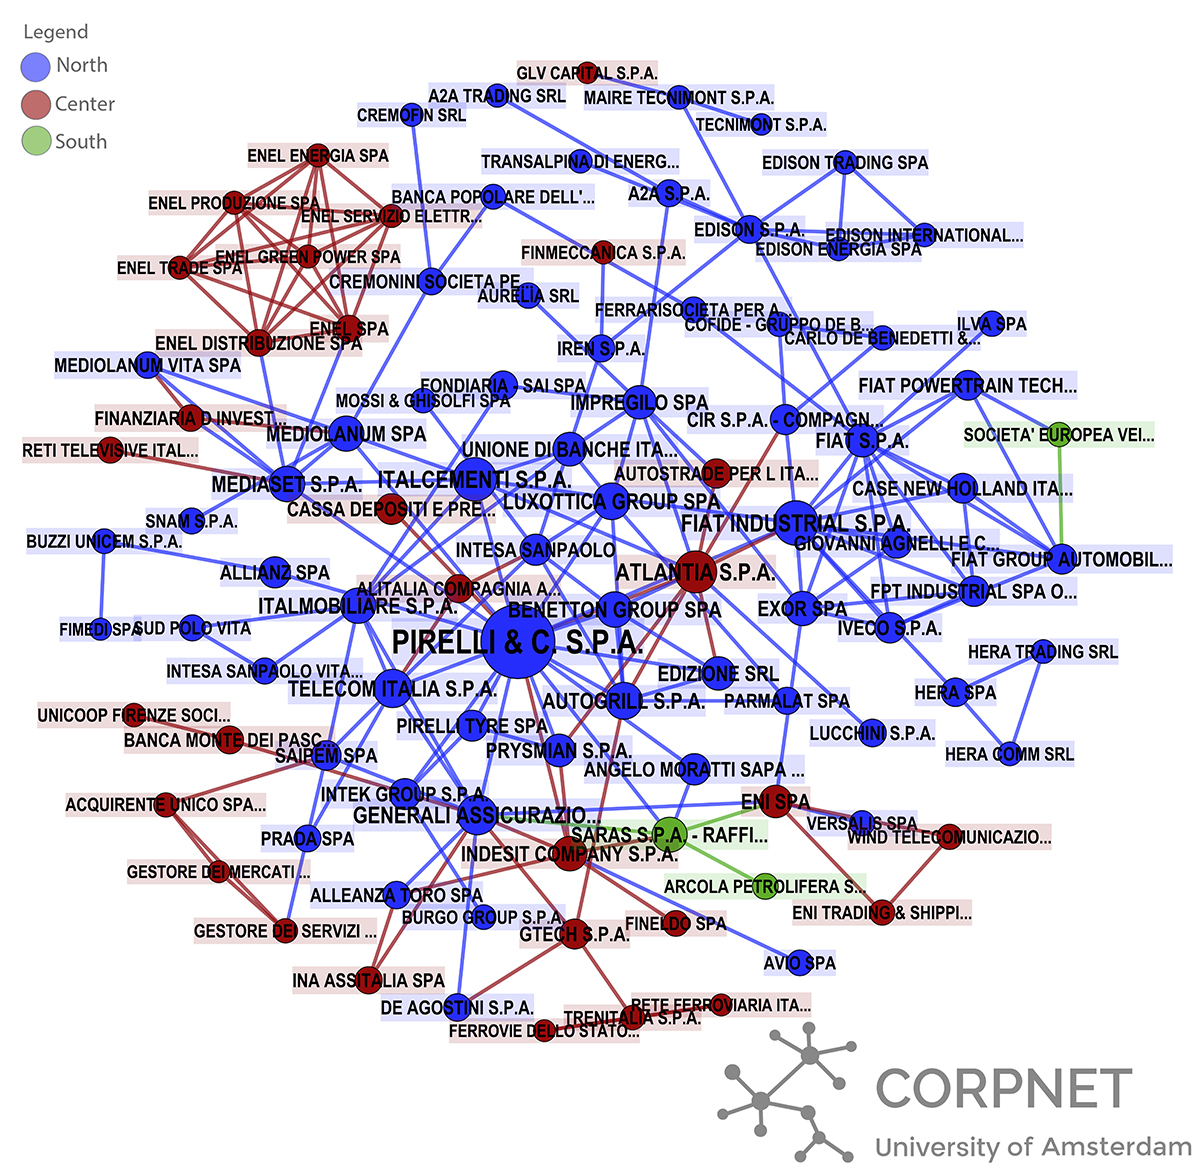
We notice that in both network visualizations the North of the country stands, most notably in Figure 6. An other important and also notable result is given by the percentage of the South present in the Top-100 network. Only the 3% of the companies from the south of the country take part in the elite (based on betweenness centrality) of the country. This could be due to different reasons. One possible reason is explained by Banca d’Italia in [2]: “By comparison with those in the Centre and North, Southern firms depend more on bank credit and have traditionally faced stiffer terms for access to it. This divergence reflects differences in the sectoral and size distribution of firms as well as differing conditions in the business environment.”
Differences between North, Center and Southern regions. Hypothetical reasons behind it.
What this still needs is a discussion of how the network describes power in the Italian corporate world. Vitali, Glattfelder and Battiston [3] studied ownership stakes held in firms by larger firms to establish where ‘control’ over their share values ultimately lay and it would be interesting to do the same here. One of their key findings was that 147 firms share control in at least the economic value of 30% of global trans national corporations. It is clear that the corporate power of Italy is in the North but with further analysis we might be able to say which companies or even individual people represent the most powerful positions in this network.
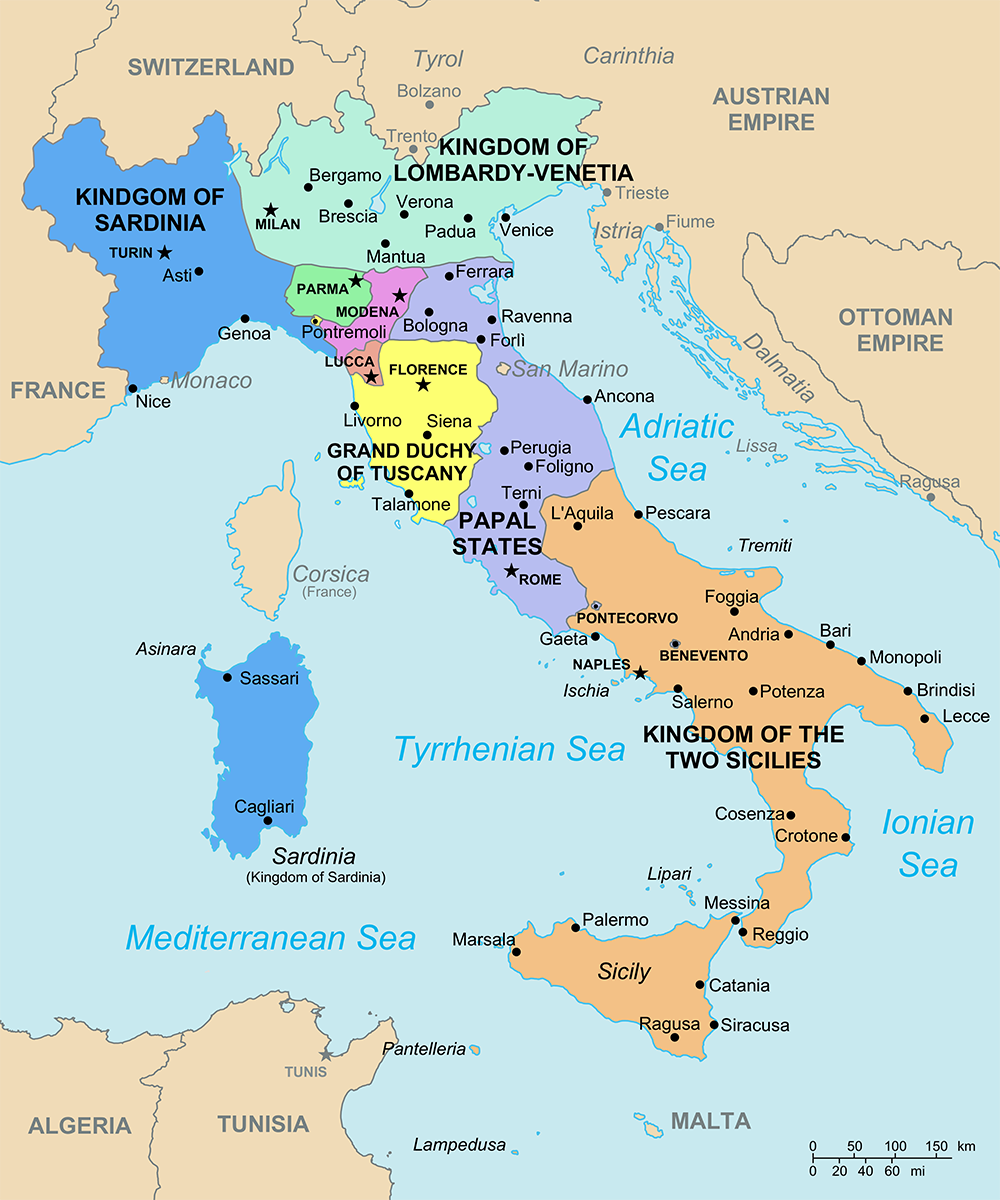
Looking only at the presence of large and very large firms there is clearly something dividing the north, centre and south of Italy. The causes and implications of this could be numerous and the potential interactions between them even more so, but at glace it is striking how closely the presence of large firms match the kingdoms of Italy before Italian unification. The contemporary reason is that firms have trouble gaining access to finance in souther regions of Italy, as mentioned above. However, if we ask what the causes of this are, it would be a plausible hypothesis that the regional political institutions of Italy have developed differently after the period of Italian unification.
Political institutions that support justice, the enforcement of contracts and education (to name a few factors) have been seen as the backbone of economic development. In a now famous global historical study Acemoglu and Robinson [4] explore the importance of these institutions and the effects ofvested political interests around them. They found that the presence or absence of ‘inclusive’ institutions during the colonial period correlated closely with the development of a country’s economy centuries later. While this approach has its critics (Boldrin, Levine and Modica [5]) it is possible that what we’re seeing here is an example of sub-national variations in political capital, stemming from institutional compromises in Italy around the formation of the state. This would explain why large firms and other indicators of economic development falls in the regions it does and would explain how it lasts over time.
It would be interesting to test this further but also suggests that the analysis of the database could have a surprising value to scholars of sub-national political economics.
In future work we will further investigate the board interlock network of Italy in the context of centrality measures and community detection.
Acknowledgment
Thanks to Nicholas Hogan for contributions to the part on hypothetical reasons.
References
[1] Caldarelli and Vespignani – “Large Scale Structure and Dynamics of Complex Networks: From Information Technology to Finance and Natural Science”.
[2] Banca d’Italia – “The economy of the Italian regions”.
[3] Vitali Stefania, James B. Glattfelder, and Stefano Battiston. “The Network of Global Corporate Control.” PLoS one, 2011: 1-6.
[4] Acemoglu, Daron, and James A. Robinson. Why Nations Fail: The Origins of Power, Prosperity, and Poverty. New York: Crown Buisness, 2012.
[5] Boldrin, Michele, David K. Levine, and Salvatore Modica. A Review of Acemoglu and Robinson’s Why Nations Fail. California, 2012.
We are glad to announce that the abstract “On Data Quality and Centrality Measures in Big Corporate Network Analysis” has been selected for a plenary presentation in the 2nd GESIS Computational Social Science Winter Symposium 2015.
Although often depicted as atomistic and individualistic market actors, corporations are tightly embedded in networks of power and control. They share board members (interlocking directorates), share owners and engage in direct shareholdings with one another. These so-called corporate networks have long formed distinct national business communities and are part of the organisation of national economies.
New databases and methods allow us to go beyond our current understanding of how the global economy is organised. However, with big corporate network data come big problems as well. In the CORPNET research group we analyse the networks of corporate control of more than 170 million companies and their directors (sourced from the ORBIS database). This rich data source provides both new methodological challenges when interpreting the result of applying for example centrality measures as well as challenges with respect to data quality assurance.
The abstract can be found here. See you in Cologne!

The CORPNET project has received a grant of EUR 41,500 for high performance computing facilities from the university’s High Performance Computing and Networking (HPCN) fund. The HPCN fund is available for non-standard eScience computing facilities and ICT infrastructure contributing to research and education.
The grant will be spent on a server architecture for the CORPNET project, including an (online) data sharing platform and an architecture with over 768GB of RAM for real-time in-memory network processing and modelling. In the coming weeks, more information will be announced on this website.
On September 1, 2015, the CORPNET group has started. A list of group members is available.